Free customised vC Ops dashboards with Standard edition
With VMware vCenter Operations Manager, you can create custom dashboards that provide at-a-glance information on custom parameters that have been gathered by the vCOps system, enabling in-depth visual analysis of information that is not represented in the default views. The custom dashboard functionality is a value-add feature only available in Enterprise and Advanced editions, but what if you want to provide an application (or environment) specific dashboard to provide the same instant information, with just Standard Edition?
Customised vCOps Dashboards for free

Although you need the advanced or enterprise editions to access the custom parameters, you can still represent the Health, Risk and Efficiency dashboard – and allow drill-down analysis of problems – and have this customised for a subset of objects. You can do this all for free, and this will probably meet most of your needs. This free technique is to customise the existing dashboards to show the Health, Risk and Efficiency information (and everything that rolls up into these badges) into a single screen that shows just the objects (such as virtual machines) that you are interested in.
Everyone loves to see a board of green lights when everything is good, and universally know that red lights indicate a problem – that is what vC Ops is so good at!
Use cases – where this technique is useful
I have been asked this many times, so I wanted to put the instructions up here for others to benefit from. The question often was related to a particular team who are responsible for an application or project – and they ask the infrastructure or virtualisation team if there are problems with the environment that could be affecting their application. For example, the SAP application team would experience a slowness and not know if this was related to the application servers, the database tier, storage or network – and ask the infrastructure department to investigate. With this technique, you can provide a URL for the SAP team to look at themselves, and they can do the initial troubleshooting and more rapidly investigate the cause (without bothering Infrastructure who may not understand the full interaction of the application).
Other examples can be for development environments, NOC style operation status consoles (think of a large screen showing lots of green status of key production objects only), pre-release environments like monitoring a new Exchange system before moving mailboxes onto it.
Do you have a separate team looking after your storage? You can give them a dashboard of just the datastores that your virtual environment uses. What about a networking team, or your security people who are only interested in some networks – create a vC Ops object group for them that only contains the items they are interested in, and then give them a URL to see it.
Using this technique, you can also make a dashboard that appears empty when there are no problems, and only shows objects that have problems, and conversely also show objects that are active and not show the grey objects that are powered off or unavailable.
Preparing vC Ops groups
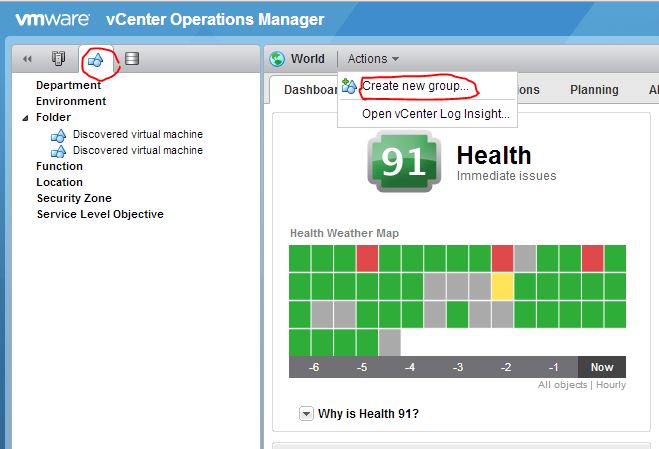
The key part of this capability is to use groups in vCOps. Log in to vC Ops and select the button with a blue square/triangle/circle icon. Then under Actions, choose “Create new group…”

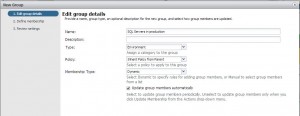
Then this will open a new dialogue that will allow you to create the group. First, give it a name and type (this will be represented in the left navigation tree). I recommend that you create a Dynamic group, so that membership can be updated automatically based on parameters you specify later. In this example I am making the group contain SQL servers.

Then you can use the “Define Membership” box to enter details about the rules to create and populate the group.
In this example, I have specified that the VM name must contain the word “SQL”. If I had selected that All objects contain the name “SQL” – then all VMs, clusters, datastores, hosts etc that contain that word in their name will automatically be a part of this group. You can specify other criteria such as VM CPU count, operating system, member of Resource Pool, CPU usage over a minimum – have an explore and you will find all the parameters you can use. Also add multiple criteria to further narrow (or expand) the objects to be included – don’t forget to press the “Preview” button to see what your criteria has found.
Another great option is to use integration with VIN (VMware Infrastructure Navigator) to identify objects based on the application (for example, include all machines running IIS/Apache/VMware View/Active Directory etc.). You can find this in “All” and in “Application” – however, VIN is bundled into vC Ops Advanced and Enterprise, which include custom dashboards anyway.
You can also manually add individual objects to always be included or excluded from this group. This is simply a matter of navigating to the object and selecting it.
Using the vC Ops Groups for dashboards
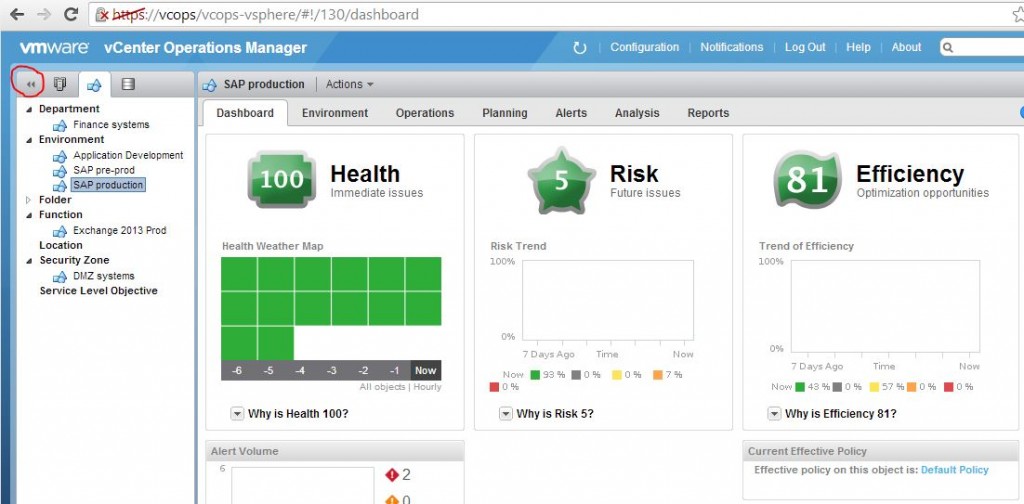
Now comes the fun part. You should see your new group in the left navigation tree of the vC Ops screen – select your new object, ensure that the “Dashboard” tab is selected and then you should see a reduced scope Dashboard that contains the objects you specified in the group. Notice that the URL has changed to something similar to https://<vcops>/vcops-vsphere/#!/130/dashboard – note that this number is not predictable, however it is consistently applied (you don’t know what the next one is, but it will always be the same URL once you have found it).
This is the URL that you want to provide to your application team / storage people / network admins. This is what they would see

You can make this a little cleaner by minimising the navigation tree on the left – press the two left arrows (circled).
Points to notice
A few things that people might question;
- What you see in vC Ops is read-only. That means, no-one can change (or break) anything in your virtual environment through using vC Ops.
- You must give a login to users who want to see vC Ops dashboards. Read my post here about creating vC Ops logins.
- Yes, once they have a login, users can escape from their dashboard to look at other parts of the infrastructure that is managed by the same vC Ops instance. You might want to address this with training, or lack of training.
- There are other benefits of vC Ops Groups.
Read my post here about vC Ops profiles
See VMware’s introduction to vC Ops dashboards at https://www.youtube.com/watch?v=S607B-GS4O8

